Dude's Multi Time-Frame Pivot System Down Only - TRIALDude's Multi Time-Frame Pivot System BETA 3 - TRIAL ONLY
This is the first public beta of a new "ribbon" type of indicator which shows trend information and pivot candle information for 8 different timeframes, all within a very compact and visually appealing space.
It is extremely useful for pinpointing trend changes or current trend by giving you information from 8 different timeframes on one chart. The idea is if multiple time-frames are in sync with each other, the stronger the signal will be. You can easily set alarms on pivot points to trigger Tradingview to send an email or SMS when an important signal appears on the chart. To trigger an alarm on a pivot alarm trigger, select the indicator in the alarm and choose 'Buy Alarm", "Sell Alarm", "Green Alarm", or "Red Alarm", depending on the indicator you are setting the alarm for. For the pivot alarm trigger, the drop down box specifiying the resolution will have no effect, so you can ignore it. You may also set individual alarms for each resolution. To do this, choose the indicator in the drop down menu, then choose the resolution in the drop down menu next to that one, and finally choose"Cross Up" and set the value to 0.5. The value of the variable holding candle data is a binary 0 or 1.
The ribbon strategy is split into 3 different indicators because of the large amount of code required to calculate everything; Up, Down, and Red/Green. Please contact me if you are interested in purchasing a subscription to the strategy or want more information. The current subscription price is starting at $50USD on a monthly basis. I plan on doing bulk trials that will start and end for a select group of people at the same time. Contact me here on tradingview via PM, or via email thedudeontv@gmail.com if you are interested.
Search in scripts for "Up down"

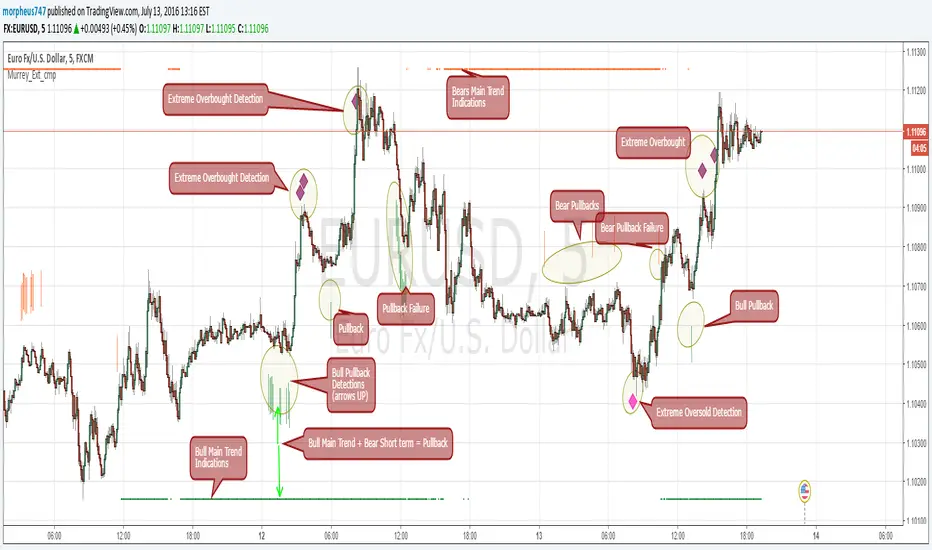
Murrey Math Extremes ComparatorHOW IT WORKS
Creates two murrey math oscillators (hidden) one with 256 length another with 32 length and compare each other.
WHAT GIVE ME THIS SCRIPT
The script can give you very valuable information:
- Main Trend
- Pullbacks detections
- Extreme overbought oversold prices alerts
- Divergences
- Any timeframe usage
REFERENCES OF USAGE
Main Trend Indications
****The main trend is indicated with green(bull) or red(bears) small "triangles" on the bottom(bull) or the top(bears) of the chart.
*****To detect the Bull/Bear major trend the script use 256 murrey, if > 0 (green) we are uptrend in other cases we are downtrend
Pullback detection
****The pullbacks are indicated with Green(bull) or red(bears) medium "Arrows"
*****To detect pullbacks the system compare the long term murrey with the short term murrey, if long term is Green(green triangles)
*****so we are in a main bull trend, if the short term murrey make an extreme low then the pullback is indicated
*****The same for the short pullback, if long term murrey is RED and we have an extreme green short term murrey we shot a red arrow
Extreme Overbught/Oversold
****The extreme OO is indicated with fancy diamonds
*****To detect the Extremes price movements we combine the two murrey, if Long Term Murrey is overbought and short term murrey too
*****Then the diamond show on the screen obove or below based on the extreme if overbought or oversold
Strategy Resume:
Triangles indicate Major Trend Up/Down
Arrows Indicate Continuation pullbacks
Diamonds Indicate Extreme Prices
GUIDE HOW TO IMAGES
How it's works Behind Scene
Kay_BBandsV3This is the 3rd version of Kay_BBands.
When +DI (Directional Index ) is above -DI , then Upper band will be visible and vice-versa.
This is when the ADX is above the threshold. 28 is the default in this version. I found its more appealing in 5M time frame.
BLUE - ADX under 10
GREEN - Uptrend, ADX over 10
RED - Downtrend, ADX over 10
Use it with another band with setting 20, 0.6 deviation. Prices keeping above or below the 2nd bands upper or lower bounds shows trending conditions.
I didn't know how to update the old script so published it again.
Changes - :
1) Updated default settings for the indicator
2) ADX setting are now DI (28), ADX (10), adx level to check is 10.
3) IMPORTANT one - When DI is up/down, lower/upper band will also have color (more visible that way.)
Play around the settings.. It really eliminates extra indicator checking visually... Please like if you think idea is good.

CM ATR PercentileRankCM ATR PercentileRank - Great For Showing Market Bottoms.
When Increased Volatility to the Downside Reaches Extreme Levels it’s Usually a Sign of a Market Bottom.
This Indicator Takes the ATR and uses a different LookBack Period to calculate the Percentile Rank of ATR Which is a Great Way To Calculate Volatility
Be Careful Of Using w/ Market Tops. Not As Reliable.
***Ability to Control ATR Period and set PercentileRank to Different Lookback Period
***Ability to Plot Histogram Just Showing Percentiles or Histogram Based on Up/Down Close
Fuchsia Lines = Greater Than 90th Percentile of Volatility based on ATR and LookBack Period.
Red Lines = Warning — 80-90th Percentile
Orange Lines = 70-80th Percentile
Other Useful Indicators
Williams Vix Fix
CM_RSI EMA Is a Great Filter for Williams Vix Fix

ORB Pressure (Futures) Your TradingView script is an ORB “pressure + confirmation” indicator built for futures that anchors the Opening Range to the NY cash open and then manages the day in three phases. First, it constructs the Opening Range high/low starting at 09:30 NY for a user-selectable duration (3/5/15/30/60 minutes) and draws those levels forward on the chart. Second, once the range is set, it computes a real-time break likelihood score (0–100) plus a directional lean (UP/DOWN/NEUTRAL) using a blend of factors traders care about: proximity to the OR edges, ATR-based compression, repeated “touches” near ORH/ORL, EMA stacking and VWAP positioning/slope, and relative volume vs a baseline. Third, it enforces a clean signal structure: it triggers a one-shot event only when a candle closes outside ORH/ORL, logs the break details (direction, price, ticks beyond the range, and time), and prevents repeat firing; however, if price closes back inside the range within a configurable number of candles, the script treats it as a failed break and resets so it can re-arm. A compact dashboard displays the live state (building/set/armed), score, lean, and it preserves the break statistics after a trigger so you can review the day’s breakout behavior at a glance.

Context Bundle | VWAP / EMA / Session HighLow (v6)
📌 0DTE Context Bundle (v6)
**VWAP • EMA Cloud • Session High/Low (NY / London / Asia)
The **0DTE Context Bundle** is a *decision-making overlay*, not a signal spam indicator.
It’s designed to help traders clearly see **value, trend, and liquidity levels** across **New York, London, and Asia sessions** — all in one clean, customizable tool.
Built for **NQ, ES, Gold, and FX pairs**, with a focus on **5–15-minute execution charts**.
---
## 🔹 What This Indicator Shows
### ✅ VWAP + ATR Bands
* Session VWAP (fair value)
* ATR-based extension bands (1x / 2x)
* Helps identify **overextension, mean reversion zones, and trend pullbacks**
### ✅ EMA 9 / 21 Cloud
* Visual trend and momentum filter
* Custom colors + opacity
* Identifies **trend continuation vs chop**
### ✅ Session High / Low Levels
* **New York RTH**
* **London**
* **Asia (midnight-safe)**
* Optional previous session highs/lows
* Adjustable line styles, widths, colors, and extensions
### ✅ Anchored VWAP (Optional)
* Reset by:
* Daily
* NY session start
* London session start
* Asia session start
* Useful for tracking **session-specific value shifts**
---
## 🔹 How Traders Use It
This indicator is meant to answer:
* *Are we trading at value or extension?*
* *Is the market trending or rotating?*
* *Where is liquidity likely sitting right now?*
Common use cases:
* Trend pullbacks into VWAP or EMA cloud
* Reversal setups at session highs/lows
* Session breakout + retest confirmation
* Overnight context for London and Asia sessions
---
## 🔹 Customization & Flexibility
Every component can be toggled and styled:
* Colors, widths, line styles
* Cloud up/down colors + opacity
* Session visibility and extensions
* VWAP band multipliers and ATR length
Members can adapt it to **their own style**, market, and timeframe.
---
## ⚠️ Disclaimer
This indicator is provided for **educational and informational purposes only**.
It does **not** provide financial advice or trade signals.
Always manage risk and confirm entries with your own strategy.

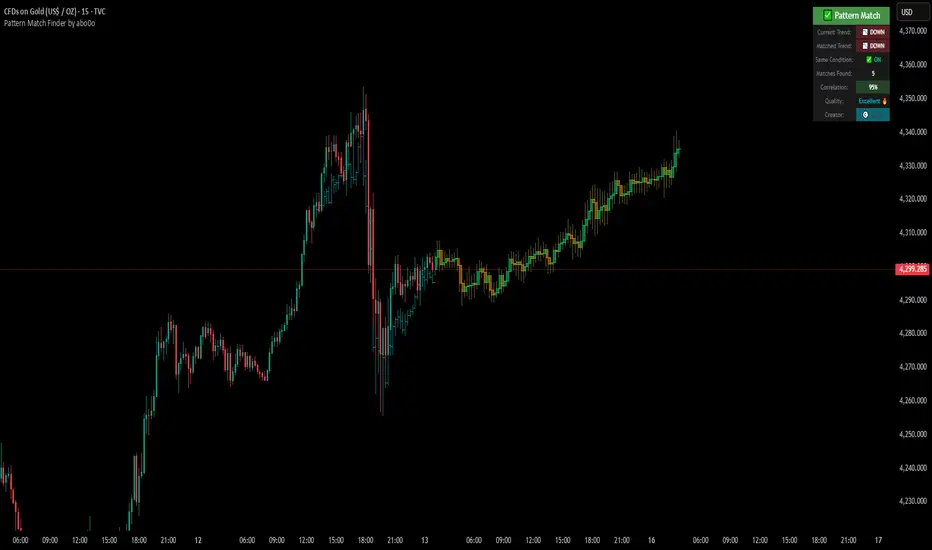
Ultimate Pattern Match FinderUltimate Pattern Match Finder - Introduction 🎯
Your Ultimate Pattern Match Finder is a sophisticated technical analysis indicator that identifies historical price patterns similar to the current market structure and projects potential future price movement based on those matches. 📊✨
Professional-Grade Trading Intelligence 💼
This indicator represents an institutional-quality pattern recognition system designed for serious traders who demand statistical rigor and data-driven decision-making. The multi-layered correlation engine and advanced projection methodology deliver enterprise-level technical analysis directly to your trading platform, transforming raw historical data into actionable market intelligence with quantifiable confidence metrics. 📈⚡
Core Functionality 🔍
The indicator scans through historical price data (up to 7000 bars) looking for patterns that closely resemble the most recent price action. When it finds matching patterns, it overlays them on your current chart and projects what happened next in those historical instances—giving you a data-driven forecast of potential future price movement. 🎯📈
Key Features ⚡
Pattern Recognition Engine 🧠 - Uses three normalization methods (Percent-from-start, Returns, Z-Score) to compare price patterns regardless of their absolute price levels. This allows patterns from different price ranges to be compared effectively.
Correlation & Distance Controls 🎚️ - You can set minimum correlation thresholds (default 75%) and maximum distance thresholds to filter matches. Only high-quality matches that meet your criteria are displayed, preventing false signals. ✅
Trend Direction Filter (Same Condition) 📈📉 - The standout "⭐ SAME CONDITION" feature ensures matches share the same trend direction (UP/DOWN/SIDEWAYS) as your current pattern. This prevents comparing bullish setups to bearish ones, significantly improving forecast relevance.
Advanced Matching Options 🔬 - Includes volume weighting to prioritize matches with similar volume profiles and shape matching to compare trend slope and volatility patterns.
Highly Developed Projection System 🚀🔮 - The crown jewel of this indicator is its sophisticated multi-match projection engine. Instead of relying on a single historical match, it intelligently aggregates the top N matches (up to 10) to create statistical projections. The system displays matched historical candles as semi-transparent teal overlays 📊, then projects future candles in lime/orange colors 🟢🟠 based on what happened after those historical patterns. Each projected candle represents the averaged behavior of multiple high-correlation matches, providing robust, probability-weighted forecasts rather than single-instance predictions. You have full control over projection length (up to 100 bars) and transparency levels for both overlays and projections. 💎
Smart Alerts 🚨 - When no matches meet your thresholds, the indicator displays a "❌ NO MATCH FOUND" alert with suggestions for adjusting your settings, preventing you from acting on weak patterns. The alert even shows how many patterns were filtered out by the trend direction requirement. ⚠️
Rich Visual Feedback 🎨 - The indicator provides a detailed info table showing match quality, correlation percentage (with color-coded ratings), trend comparison with emojis (📈 UP, 📉 DOWN, ➡️ SIDEWAYS), and actionable quality ratings (Excellent 🔥, Very Good ✅, Good 👍, Fair ⚠️).
This tool transforms historical pattern analysis into actionable trading intelligence by showing you not just what patterns match, but what happened next with statistical confidence. 💪🎯
Special Thanks 🙏
A heartfelt thank you to TradingView for providing the powerful Pine Script framework and world-class charting platform that makes advanced indicators like this possible. Their commitment to empowering traders with professional tools and an innovative development environment continues to push the boundaries of what retail traders can achieve. 💙📊
©️ Created by abo0o - All Rights Reserved
📬 Get Access
DM me for access to the Ultimate Pattern Match Finder!
I'm happy to answer any questions you have about the indicator, setup, or optimization for your trading style. Whether you need guidance on parameter settings, strategy integration, or technical support—feel free to reach out! 😊✨
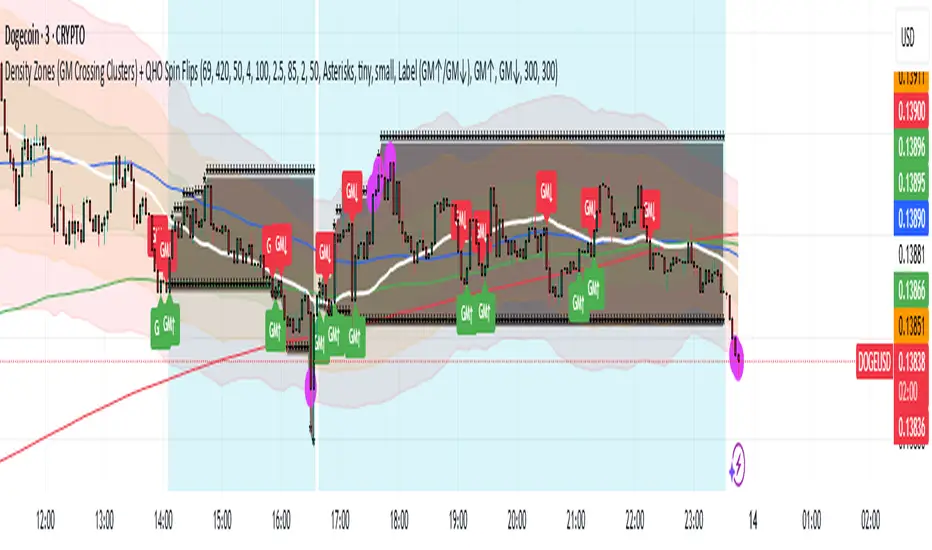
Density Zones (GM Crossing Clusters) + QHO Spin FlipsINDICATOR NAME
Density Zones (GM Crossing Clusters) + QHO Spin Flips
OVERVIEW
This indicator combines two complementary ideas into a single overlay: *this combines my earlier Geometric Mean Indicator with the Quantum Harmonic Oscillator (Overlay) with additional enhancements*
1) Density Zones (GM Crossing Clusters)
A “Density Zone” is detected when price repeatedly crosses a Geometric Mean equilibrium line (GM) within a rolling lookback window. Conceptually, this identifies regions where the market is repeatedly “snapping” across an equilibrium boundary—high churn, high decision pressure, and repeated re-selection of direction.
2) QHO Spin Flips (Regression-Residual σ Breaches)
A “Spin Flip” is detected when price deviates beyond a configurable σ-threshold (κ) from a regression-based equilibrium, using normalized residuals. Conceptually, this marks excursions into extreme states (decoherence / expansion), which often precede a reversion toward equilibrium and/or a regime re-scaling.
These two systems are related but not identical:
- Density Zones identify where equilibrium crossings cluster (a “singularity”/anchor behavior around GM).
- Spin Flips identify when price exceeds statistically extreme displacement from the regression equilibrium (LSR), indicating expansion beyond typical variance.
CORE CONCEPTS AND FORMULAS
SECTION A — GEOMETRIC MEAN EQUILIBRIUM (GM)
We define two moving averages:
(1) MA1_t = SMA(close_t, L1)
(2) MA2_t = SMA(close_t, L2)
We define the equilibrium anchor as the geometric mean of MA1 and MA2:
(3) GM_t = sqrt( MA1_t * MA2_t )
This GM line acts as an equilibrium boundary. Repeated crossings are interpreted as high “equilibrium churn.”
SECTION B — CROSS EVENTS (UP/DOWN)
A “cross event” is registered when the sign of (close - GM) changes:
Define a sign function s_t:
(4) s_t =
+1 if close_t > GM_t
-1 if close_t < GM_t
s_{t-1} if close_t == GM_t (tie-breaker to avoid false flips)
Then define the crossing event indicator:
(5) crossEvent_t = 1 if s_t != s_{t-1}
0 otherwise
Additionally, the indicator plots explicit cross markers:
- Cross Above GM: crossover(close, GM)
- Cross Below GM: crossunder(close, GM)
These provide directional visual cues and match the original Geometric Mean Indicator behavior.
SECTION C — DENSITY MEASURE (CROSSING CLUSTER COUNT)
A Density Zone is based on the number of cross events occurring in the last W bars:
(6) D_t = Σ_{i=0..W-1} crossEvent_{t-i}
This is a “crossing density” score: how many times price has toggled across GM recently.
The script implements this efficiently using a cumulative sum identity:
Let x_t = crossEvent_t.
(7) cumX_t = Σ_{j=0..t} x_j
Then:
(8) D_t = cumX_t - cumX_{t-W} (for t >= W)
cumX_t (for t < W)
SECTION D — DENSITY ZONE TRIGGER
We define a Density Zone state:
(9) isDZ_t = ( D_t >= θ )
where:
- θ (theta) is the user-selected crossing threshold.
Zone edges:
(10) dzStart_t = isDZ_t AND NOT isDZ_{t-1}
(11) dzEnd_t = NOT isDZ_t AND isDZ_{t-1}
SECTION E — DENSITY ZONE BOUNDS
While inside a Density Zone, we track the running high/low to display zone bounds:
(12) dzHi_t = max(dzHi_{t-1}, high_t) if isDZ_t
(13) dzLo_t = min(dzLo_{t-1}, low_t) if isDZ_t
On dzStart:
(14) dzHi_t := high_t
(15) dzLo_t := low_t
Outside zones, bounds are reset to NA.
These bounds visually bracket the “singularity span” (the churn envelope) during each density episode.
SECTION F — QHO EQUILIBRIUM (REGRESSION CENTERLINE)
Define the regression equilibrium (LSR):
(16) m_t = linreg(close_t, L, 0)
This is the “centerline” the QHO system uses as equilibrium.
SECTION G — RESIDUAL AND σ (FIELD WIDTH)
Residual:
(17) r_t = close_t - m_t
Rolling standard deviation of residuals:
(18) σ_t = stdev(r_t, L)
This σ_t is the local volatility/width of the residual field around the regression equilibrium.
SECTION H — NORMALIZED DISPLACEMENT AND SPIN FLIP
Define the standardized displacement:
(19) Y_t = (close_t - m_t) / σ_t
(If σ_t = 0, the script safely treats Y_t = 0.)
Spin Flip trigger uses a user threshold κ:
(20) spinFlip_t = ( |Y_t| > κ )
Directional spin flips:
(21) spinUp_t = ( Y_t > +κ )
(22) spinDn_t = ( Y_t < -κ )
The default κ=3.0 corresponds to “3σ excursions,” which are statistically extreme under a normal residual assumption (even though real markets are not perfectly normal).
SECTION I — QHO BANDS (OPTIONAL VISUALIZATION)
The indicator optionally draws the standard σ-bands around the regression equilibrium:
(23) 1σ bands: m_t ± 1·σ_t
(24) 2σ bands: m_t ± 2·σ_t
(25) 3σ bands: m_t ± 3·σ_t
These provide immediate context for the Spin Flip events.
WHAT YOU SEE ON THE CHART
1) MA1 / MA2 / GM lines (optional)
- MA1 (blue), MA2 (red), GM (green).
- GM is the equilibrium anchor for Density Zones and cross markers.
2) GM Cross Markers (optional)
- “GM↑” label markers appear on bars where close crosses above GM.
- “GM↓” label markers appear on bars where close crosses below GM.
3) Density Zone Shading (optional)
- Background shading appears while isDZ_t = true.
- This is the period where the crossing density D_t is above θ.
4) Density Zone High/Low Bounds (optional)
- Two lines (dzHi / dzLo) are drawn only while in-zone.
- These bounds bracket the full churn envelope during the density episode.
5) QHO Bands (optional)
- 1σ, 2σ, 3σ shaded zones around regression equilibrium.
- These visualize the current variance field.
6) Regression Equilibrium (LSR Centerline)
- The white centerline is the regression equilibrium m_t.
7) Spin Flip Markers
- A circle is plotted when |Y_t| > κ (beyond your chosen σ-threshold).
- Marker size is user-controlled (tiny → huge).
HOW TO USE IT
Step 1 — Pick the equilibrium anchor (GM)
- L1 and L2 define MA1 and MA2.
- GM = sqrt(MA1 * MA2) becomes your equilibrium boundary.
Typical choices:
- Faster equilibrium: L1=20, L2=50 (default-like).
- Slower equilibrium: L1=50, L2=200 (macro anchor).
Interpretation:
- GM acts like a “center of mass” between two moving averages.
- Crosses show when price flips from one side of equilibrium to the other.
Step 2 — Tune Density Zones (W and θ)
- W controls the time window measured (how far back you count crossings).
- θ controls how many crossings qualify as a “density/singularity episode.”
Guideline:
- Larger W = slower, broader density detection.
- Higher θ = only the most intense churn is labeled as a Density Zone.
Interpretation:
- A Density Zone is not “bullish” or “bearish” by itself.
- It is a condition: repeated equilibrium toggling (high churn / high compression).
- These often precede expansions, but direction is not implied by the zone alone.
Step 3 — Tune the QHO spin flip sensitivity (L and κ)
- L controls regression memory and σ estimation length.
- κ controls how extreme the displacement must be to trigger a spin flip.
Guideline:
- Smaller L = more reactive centerline and σ.
- Larger L = smoother, slower “field” definition.
- κ=3.0 = strong extreme filter.
- κ=2.0 = more frequent flips.
Interpretation:
- Spin flips mark when price exits the “normal” residual field.
- In your model language: a moment of decoherence/expansion that is statistically extreme relative to recent equilibrium.
Step 4 — Read the combined behavior (your key thesis)
A) Density Zone forms (GM churn clusters):
- Market repeatedly crosses equilibrium (GM), compressing into a bounded churn envelope.
- dzHi/dzLo show the envelope range.
B) Expansion occurs:
- Price can release away from the density envelope (up or down).
- If it expands far enough relative to regression equilibrium, a Spin Flip triggers (|Y| > κ).
C) Re-coherence:
- After a spin flip, price often returns toward equilibrium structures:
- toward the regression centerline m_t
- and/or back toward the density envelope (dzHi/dzLo) depending on regime behavior.
- The indicator does not guarantee return, but it highlights the condition where return-to-field is statistically likely in many regimes.
IMPORTANT NOTES / DISCLAIMERS
- This indicator is an analytical overlay. It does not provide financial advice.
- Density Zones are condition states derived from GM crossing frequency; they do not predict direction.
- Spin Flips are statistical excursions based on regression residuals and rolling σ; markets have fat tails and non-stationarity, so σ-based thresholds are contextual, not absolute.
- All parameters (L1, L2, W, θ, L, κ) should be tuned per asset, timeframe, and volatility regime.
PARAMETER SUMMARY
Geometric Mean / Density Zones:
- L1: MA1 length
- L2: MA2 length
- GM_t = sqrt(SMA(L1)*SMA(L2))
- W: crossing-count lookback window
- θ: crossing density threshold
- D_t = Σ crossEvent_{t-i} over W
- isDZ_t = (D_t >= θ)
- dzHi/dzLo track envelope bounds while isDZ is true
QHO / Spin Flips:
- L: regression + residual σ length
- m_t = linreg(close, L, 0)
- r_t = close_t - m_t
- σ_t = stdev(r_t, L)
- Y_t = r_t / σ_t
- spinFlip_t = (|Y_t| > κ)
Visual Controls:
- toggles for GM lines, cross markers, zone shading, bounds, QHO bands
- marker size options for GM crosses and spin flips
ALERTS INCLUDED
- Density Zone START / END
- Spin Flip UP / DOWN
- Cross Above GM / Cross Below GM
SUMMARY
This indicator treats the Geometric Mean as an equilibrium boundary and identifies “Density Zones” when price repeatedly crosses that equilibrium within a rolling window, forming a bounded churn envelope (dzHi/dzLo). It also models a regression-based equilibrium field and triggers “Spin Flips” when price makes statistically extreme σ-excursions from that field. Used together, Density Zones highlight compression/decision regions (equilibrium churn), while Spin Flips highlight extreme expansion states (σ-breaches), allowing the user to visualize how price compresses around equilibrium, releases outward, and often re-stabilizes around equilibrium structures over time.
Ripster Clouds + Saty Pivot + RVOL + Trend1. Ripster EMA Clouds (local + higher timeframe)
Local timeframe (your chart TF):
Plots up to 5 EMA clouds (8/9, 5/12, 34/50, 72/89, 180/200 – configurable).
Each cloud is:
One short EMA and one long EMA.
A filled band between them.
Color logic:
Cloud is bullish when short EMA > long EMA (green/blue-ish tone).
Bearish when short EMA < long EMA (red/orange/pink tone).
You can choose:
EMA vs SMA,
Whether to show the lines,
Per-cloud toggles.
MTF Clouds:
Two higher-timeframe EMA clouds:
Cloud 1: 50/55
Cloud 2: 20/21
Computed on a higher TF (default D, but configurable).
Show as thin lines + transparent bands.
Used for:
Visual higher-TF trend,
Optional signal filter (MTF must agree for trades).
2. Saty Pivot Ribbon (time-warped EMAs)
This is basically your Saty Pivot Ribbon integrated:
Uses a “Time Warp” setting to overlay EMAs from another timeframe.
EMAs:
Fast, Pivot, Slow (defaults 8 / 21 / 34).
Clouds:
Fast cloud between fast & pivot EMAs.
Slow cloud between pivot & slow EMAs.
Bullish/bearish colors are distinct from Ripster colors.
Optional highlights:
Can highlight fast/pivot/slow lines separately.
Conviction EMAs:
13 and 48 EMAs (configurable).
When fast conviction EMA crosses over/under slow:
You get triangle arrows (bullish/bearish conviction).
Bias candles:
If enabled, candles are recolored based on:
Price vs Bias EMA,
Candle up/down/doji,
So you see bullish/bearish “bias” directly in candle colors.
3. DTR vs ATR panel (range vs average)
In a small table panel (bottom-center by default):
Computes higher-TF ATR (default 14, TF auto D/W/M, smoothing type selectable).
Measures current range (high–low) on that TF.
Displays:
DTR: X vs ATR: Y Z% (+/-Δ% vs prev)
Where:
Z% = current range / ATR * 100.
Δ% = change vs previous bar’s Z%.
Background color:
Greenish for low move (<≈70%),
Red for high move (≥≈90%),
Yellow in between,
Slightly dimmed when price is below bias EMA.
This tells you: “Is today an average, quiet, or explosive day compared to normal?”
4. SMA Divergence panel
Separate histogram & line panel:
Fast and slow SMAs (default 14 & 30).
Computes price divergence vs SMA in %:
% above/below slow SMA,
% above/below fast SMA.
Shows:
Slow SMA divergence as a semi-transparent column,
Fast SMA divergence as a solid column on top,
EMA of the slow divergence (trend line) colored:
Blue when rising,
Orange/red when falling.
Static upper/lower bands with fill, plus optional zero line.
This gives you a feel for how stretched price is vs its anchors.
5. RVOL table (relative volume)
Small 3×2 table (bottom-right by default):
Inputs:
Average length (default 50 bars),
Optionally show previous candle RVOL.
Calculates:
RVOL now = volume / avg(volume N bars) * 100,
RVOL prev,
RVOL momentum (now – prev) for data window only.
Table columns:
Candle Vol,
RVOL (Now),
RVOL (Prev).
Colors:
200% → “high RVOL” color,
100–200% → “medium RVOL” color,
<100% → “low RVOL” color,
Slightly dimmer if price is below bias EMA.
This is used both visually and optionally as a signal filter (e.g., only trade when RVOL ≥ threshold).
6. Trend Dashboard (Price + 34/50 + 5/12)
Top-right trend box with 3 rows:
Price Action row:
Uses either Bias EMA or custom EMA on close to say:
Bullish (close > trend EMA),
Bearish (close < trend EMA),
Flat.
Ripster 34/50 Cloud row:
Uses 34/50 EMAs: bullish if 34>50, bearish if 34<50.
Ripster 5/12 Cloud row:
Uses 5/12 EMAs: bullish if 5>12, bearish if 5<12.
Then it does a vote:
Counts bullish votes (Price, 34/50, 5/12),
Counts bearish votes,
Depending on mode:
Majority (2 of 3) or Strict (3 of 3).
Output:
Overall Bullish / Bearish / Sideways.
You also get an optional label on the chart like
Overall: Bullish trend with color, and an optional background tint (green/red for bull/bear).
7. VWAP + Buy/Sell Signals
VWAP is plotted as a white line.
Fast “trend” cloud mid: average of 5 & 12 EMAs.
Slow “trend” cloud mid: average of 34 & 50 EMAs.
Buy condition:
5/12 crosses above 34/50 (bullish cloud flip),
Price > VWAP,
Optional filter: MTF Cloud 1 bullish (50/55 on higher TF),
Optional filter: RVOL >= threshold.
Sell condition:
5/12 crosses below 34/50,
Price < VWAP,
Optional same filters but bearish.
When conditions are met:
Plots BUY triangle up below price (distinct teal/green tone).
Plots SELL triangle down above price (distinct magenta/orange tone).
Alert conditions are defined for:
BUY / SELL signals,
Overall Bullish / Bearish / Sideways change,
MTF Cloud 1 trend flips.
8. Data Window metrics
For easy backtesting / inspection via TradingView’s data window, it exposes:
DTR% (Current) and DTR% Momentum,
RVOL% (Now), RVOL% (Prev), RVOL% Momentum.
TL;DR – What does this script do for you?
It turns your chart into a multi-framework trend and momentum dashboard:
Ripster EMA clouds for short/medium trend & S/R.
Saty Ribbon for higher-TF pivot structure and conviction.
RVOL + DTR/ATR for context (is this a big and well-participated move?).
SMA divergence panel for overextension/stretch.
A compact trend table that tells you Price vs 34/50 vs 5/12 in one glance.
Buy/Sell markers + alerts when:
short-term Ripster trend (5/12) flips over/under medium (34/50),
price agrees with VWAP,
plus optional filters (MTF trend and / or RVOL).
Basically: it’s a trend + confirmation + context system wrapped into one indicator, with most knobs configurable in the settings.

Breakout Scanner Checklist for Swing Trades📈 EOD Breakout Scanner Checklist Overview
This indicator combines Mark Minervini's legendary Trend Template criteria with additional breakout detection enhancements, specifically optimized for end-of-day (EOD) scanning and Qullamaggie-style momentum trading.
Perfect for swing traders who scan stocks after market close and execute breakout entries on the first 5-minute candle after market open.
🎯 Core Features
1. Complete Minervini Trend Template (8 Criteria)
Implements all 7 rules from Mark Minervini's trend template methodology:
- Price above 150 & 200 day EMAs (long-term uptrend)
- EMA(150) above EMA(200) (trend alignment)
- EMA(200) trending up for at least 1 month (sustained trend)
- EMA(50) above both 150 & 200 EMAs (intermediate strength)
- Current price above EMA(50) (short-term momentum)
- Price at least 25% above 52-week low (sufficient rally)
- Price within 25% of 52-week high (near strength)
- (additional) Price within 10% above EMA(10) (not overextended)
2. Enhanced Breakout Detection (Toggle On/Off)
Three powerful enhancements that can be individually enabled:
Stage Analysis - Identifies stocks in Weinstein Stage 2 (advancing phase)
- Confirms proper EMA alignment
- Validates upward slope of 200 EMA
- Filters out late-stage or declining trends
Volatility Squeeze - Detects "coiled spring" setups
- ATR compression (recent volatility < 80% of average)
- Bollinger Band squeeze detection
- Identifies tight consolidations before explosive moves
Price Action Quality - Measures clean accumulation
- Up/down day ratio (prefers >1.2 ratio)
- Controlled price range (< 20% over 20 days)
- Filters erratic, whipsaw price action
3. Dual Table System
Main Table - Focus on what matters
- Shows only enabled enhanced criteria
- 🚀 BREAKOUT SIGNAL - Clear YES/NO verdict
- Clean visual hierarchy
Support Table (Optional) - Deep dive analysis
- All 8 Minervini criteria with status
- Can be toggled on/off for cleaner charts
- Perfect for understanding why a signal triggered
🔧 How To Use
For EOD Scanning:
- Run this indicator on your stock universe after market close
- Look for stocks showing 🚀 BREAKOUT SIGNAL = YES for quick scan or use the support table to reach more details for deep down analysis
- Add the stocks falls with your criteria to your watchlist for the next trading day
For Intraday Execution:
- At market open, watch your watchlist from EOD scan
- Identify the pivot point (recent resistance high, possible PDH)
- Wait for price to break above pivot on first 5-min candle
- Confirm with volume
- Enter if both price + volume confirm breakout
Note on Volume:
This indicator intentionally does NOT include volume confirmation in the signal, as it's designed for EOD scanning. You should manually verify volume when the actual breakout occurs at market open.
🎨 Visual Features
- EMA(10) Zone: Purple shaded area showing 10% zone above EMA(10)
- 52-Week High/Low Lines: Orange reference lines (toggleable)
- Modern Dark Theme: Low-contrast, professional design easy on the eyes
- Clean Status Indicators: ✓ for pass, ✗ for fail
⚙️ Customizable Settings
Display Options:
- Toggle 52-week high/low lines
- Toggle EMA(10) +10% zone
- Adjust lookback periods
Enhanced Detection:
- Enable/disable Stage Analysis
- Enable/disable Volatility Squeeze
- Enable/disable Price Action Quality
Panel Settings:
- Position tables (top/middle/bottom, left/center/right)
- Show/hide Minervini criteria support table
📚 Best For
✅ Swing traders looking for momentum breakouts
✅ Traders using EOD scanning + intraday execution
✅ Minervini/O'Neil CANSLIM methodology followers
✅ Qullamaggie-style breakout traders
✅ Anyone seeking high-probability setups with institutional backing
💡 Trading Strategy Context
This indicator is based on proven methodologies:
- Mark Minervini: SEPA (Specific Entry Point Analysis) and Trend Template
- Kristjan Qullamaggie: Momentum breakouts with volume confirmation
- Stan Weinstein: Stage Analysis for market cycle timing
Combined, these create a powerful framework for identifying stocks with:
- Strong institutional sponsorship
- Proper trend structure
- Tight consolidation (coiled energy)
- Clean accumulation patterns
- High probability of continuation
⚠️ Disclaimer
This indicator is a screening and analysis tool, not a trading system. It helps identify potential setups but does not provide entry/exit signals. Always:
- Verify volume at actual breakout
- Use proper position sizing
- Set stop losses
- Manage risk appropriately
- Do your own due diligence
Past performance does not guarantee future results.
📖 Credits
Based on Mark Minervini's Trend Template methodology and enhanced with modern breakout detection techniques. Original code/influence by yogy.frestarahmawan.
Happy Trading! 🚀
If you find this indicator useful, please give it a thumbs up and share your feedback!

Gold Sniper V21: M15 Holding MasterGold Sniper Entry (Follow Trend to enter)
My Indicator :
- Clarify the M30 in Up/Down Trend
- Only entry the trade in M1/M5 Timeframe to make a Sniper Entry.
- Indicator will show when to TP before the Trend Change

Momentum Candle by DNDFXMomentum Candle v2 is a simple yet powerful indicator designed to detect strong momentum candles based on candle body size and the ratio between the body and total wick.
This indicator is ideal for traders who focus on:
Momentum trading
Breakout strategies
XAUUSD (Gold) scalping
Supply & Demand / Smart Money Concepts (SMC) confirmation
🔧 How the Indicator Works
The indicator analyzes each candle and classifies it as a Bullish Momentum or Bearish Momentum candle when these conditions are met:
✅ The candle body exceeds the minimum size
✅ The total wick is smaller compared to the body
✅ The Body-to-Wick ratio meets the strength filter
Visual signals include:
Green background for bullish momentum
Red background for bearish momentum
Up/Down triangle markers as entry guidance
⚙️ Customizable Parameters
Min Body Size (Points) – Sets the minimum candle body size
Min Body : Wick Ratio – Controls how dominant the body is compared to the wicks
All parameters can be optimized according to your trading style and timeframe.
✅ Best Use Cases
This indicator is useful for:
Breakout confirmation
Momentum validation
Filtering false breakouts
Scalping and intraday trading on XAUUSD
🧠 Trading Tips
For better accuracy, combine this indicator with:
Support & Resistance
Supply & Demand zones
Break of Structure (BOS) / CHoCH
Best performance on M5 – H1 timeframes.
⚠️ DISCLAIMER
This indicator is a supporting tool, not a guaranteed profit system. Always apply proper risk management. You are fully responsible for your trading decisions.

🟡 GOLD 4H HUD v8.9 — Loose ICT OB + Strong/Weak + FVG/HVN/LVNGOLD 4H HUD v8.9 is a clean, structured Smart Money Concepts (SMC)–based analysis tool designed exclusively for XAUUSD on the 4-hour timeframe.
It focuses on the three most important elements for institutional orderflow analysis:
✔ Loose ICT Order Blocks (Demand/Supply)
✔ Fair Value Gaps (FVG)
✔ Volume Profile Zones (HVN/LVN/POC)
The script builds a professional-style HUD that displays the key institutional regions and structural levels that matter most for gold traders.
📌 Key Features
1 — Market Structure Engine (HH/HL & BOS)
The indicator detects:
Minor swing Highs and Lows
Last confirmed HH / HL levels
Break of Structure (BOS) for directional bias
EMA-200 trend filter (UP / DOWN / NEUTRAL)
This gives traders a clean structural read without clutter or noise.
2 — Loose FVG Engine (Tolerance-Based ICT Gaps)
A soft-threshold FVG engine detects “loose” Fair Value Gaps using a 0.1% price tolerance.
This method ensures:
Fewer missed imbalances
Cleaner OB/FVG alignment
Higher accuracy on 4H gold displacement legs
FVGs automatically shift to the right side of the chart for clean visualization.
3 — Order Block Engine (Demand/Supply + Strong/Weak Classification)
A simplified ICT-style OB engine scans the past few candles whenever BOS is detected.
It identifies:
Demand OB during bullish BOS
Supply OB during bearish BOS
Strong OB if fully nested inside an active FVG
Weak OB otherwise
OB boxes include:
Clear color coding (strong vs. weak)
Price range labels inside each box
Automatic right-shift for visual clarity
4 — Volume Profile Engine (POC / HVN / LVN / VAH / VAL)
Based on a rolling window (default 120 bars), the script builds a lightweight volume distribution.
It displays:
POC (Point of Control)
HVN (High Volume Node)
LVN (Low Volume Node)
Value Area High / Low
HVN/LVN zones are shown as right-shifted colored boxes with price labels.
These zones help identify:
Institutional accumulation
Low-liquidity rejection points
Areas where price tends to react strongly
5 — Support / Resistance Mapping
The script automatically generates:
OB-based support/resistance
Swing-high/swing-low levels
HVN/LVN structural levels
These are displayed in the HUD for fast reference.
6 — Professional HUD Panel
A compact, easy-to-read HUD summarizes:
Trend direction
Latest HH/HL
OB ranges (Strong/Weak)
HVN/LVN price zones
POC
Multi-layer support & resistance
This turns the script into a fully functional analysis dashboard.
📌 What This Indicator Is NOT
To avoid misunderstanding:
It does not take entries or generate buy/sell signals
It does not auto-detect CHOCH, MSS, SMT, or sweeps
It is not a trading bot
This tool is designed as an institutional-style map and analysis HUD, not a strategy.
📌 Best Use Case
This indicator is ideal for traders who want to:
Read institutional structure on XAUUSD
Identify clean Demand/Supply zones
Visualize FVG/OB/HVN interactions
Track high-value liquidity levels
Build directional bias on 4H before dropping to execution timeframes
⚠ Important Note
This tool is designed exclusively for the 4H timeframe.
Using it on lower timeframes will display a warning.

Execution Heatmap v4.1 — AI EnhancedThis indicator is an AI‑style execution dashboard that compresses structure, momentum, volume, volatility, and risk into a compact heatmap panel plus BUY/SELL signals on the chart. It is specifically tuned for gold and silver, automatically adapting its thresholds to the volatility profile of XAU/GC and XAG/SI symbols.
Core architecture
The system builds a multi‑factor model in layers:
Adaptive structure engine: Tracks dynamic higher‑high / lower‑low progression using rolling reference highs and lows, classifying price as structural UP, DOWN, or NEUTRAL.
Precision VWAP bias: Uses VWAP with a small threshold band to filter out noise and label price as ABOVE, BELOW, or neutral relative to value.
Impulse & angle: Combines short‑term rate of change and normalized slope (price vs ATR over 5 bars) to detect directional thrust, then clamps values into
for stable scoring.
Volume, wicks, and patterns
Adaptive volume tiers: Uses a 20‑bar volume average with gold/silver‑specific multipliers to tag candles as SURGE, HIGH, NORMAL, or LOW volume, with distinct coloring for extremes.
Wick analytics: Measures upper/lower wick size vs total range to detect demand/supply style rejections and encode them as bullish or bearish wick signals.
AI pattern score: Blends structure, VWAP, impulse, wicks, and angle into a normalized pattern score, then classifies it as STRONG↑, NEU↑, NEU, NEU↓, or STRONG↓ with color‑coded emphasis.
AI scoring and prediction layer
Predictive engine: Uses a neural‑network‑style weighted sum of structure, VWAP, impulse, wicks, angle, volume, and pattern to generate a prediction score in
, then converts it into a percentage and arrow (↑, ↑↑, ↓, ↓↓, →) for intuitive directional bias.
Execution score: Aggregates key factors into an EXEC score (0–200+ style scale), color‑graded from weak (red) through medium (orange) to strong (green) execution context.
Uncertainty & risk: Separately models uncertainty (low impulse/angle or low conviction) and risk (fake breaks, VWAP position, uncertainty tier, low volume), then feeds them into a combined confidence calculation.
Final signal & confidence
Final classification:
BUY: High exec score, high confidence, and controlled risk.
SELL: Very low exec score, low confidence in upside, and acceptable risk.
WAIT: All other conditions where edge or clarity is insufficient.
Confidence bar: A textual mini‑bar (🟩 blocks) plus percentage shows how strong the current signal environment is, making it easy to visually gauge setup quality at a glance.
Professional heatmap panel
A two‑column table in the top‑right of the chart organizes the logic into layers:
Base layer: STRUCT, VWAP, IMPULSE, VOLUME.
AI layer: FAKE, REGIME (Trend/Pullback/Reverse/Chop), ANGLE.
Decision layer: PATTERN, PREDICT, EXEC, RISK, CONF, and FINAL direction.

RVOL + Volume Z-Score (Textbook)This indicator is a relative-volume and “volume anomaly” dashboard designed to help you quickly spot when a ticker is actually in-play versus simply drifting on normal activity. It plots standard volume bars (colored by up/down candles) and overlays multiple optional smoothers of volume (SMA, LSMA/linear-regression MA, HMA, ALMA) so you can see whether participation is expanding or fading across different smoothing styles. It also calculates RVOL (current bar volume divided by the average volume over a user-defined lookback) and displays RVOL (and Z) in a small table for quick reference.
The core feature is a textbook volume z-score: Z=(V−SMA(V,N))/StDev(V,N)
This measures how far the current bar’s volume is from its recent average in standard-deviation units, making it easy to filter for genuinely unusual volume. The script plots mean + 1σ and mean + 2σ threshold bands and can highlight “anomaly” volume bars when Z exceeds your chosen σ thresholds (default 1σ for broader detection, with alerts available for 1σ/2σ). Use it as a participation filter: combine high RVOL / high Z with your price structure (key levels, VWAP, trend) to validate breakouts or identify high-conviction reversal/flush events.

HL/2 Fast & Slow - Cloud Signals + Backtest + Exit AlarmsDescription:
This indicator plots two HL/2 moving averages—a fast and a slow line—on the chart, along with dynamic upper and lower bands based on the slow line and ATR. It features a colored cloud between the two averages to visualize trend direction, and it provides buy/sell signals based on the alignment of the two lines.
Key Features:
Fast & Slow HL/2 Averages
Fast and slow HL/2 lines calculated as simple moving averages.
Lines change color based on direction (up/down), configurable via style settings.
Dynamic Upper and Lower Bands
Bands calculated from the slow line using ATR to capture volatility.
Trend Cloud
Fills the area between fast and slow lines.
Green if both lines are rising, red if both are falling, gray if lines disagree.
Transparency adjustable for better visual clarity.
Buy/Sell Signals
Signals appear only when both lines align in the same direction.
Two modes available:
Series Signals: generates a signal whenever the cloud color changes.
Single Signal: generates a signal only when the slow line changes direction.
Signals are plotted as small triangles above/below bars.
Alerts can be set for both buy/sell signals.
Exit Modes and Alerts
Exit positions either on a reverse signal or when the cloud enters a neutral gray zone.
Exit alerts are available for both conditions.
Integrated Backtest Panel
Shows total trades, win rate, and cumulative profit in USD.
Considers position size and commission (configurable).
Panel color indicates profit (green) or loss (red).
Fixed position on chart for easy reference.
Inputs:
Fast and slow periods, ATR length, ATR multiplier.
Position size, commission percentage.
Signal mode (Series or Single).
Exit mode (Reverse Signal or Gray Area).
Style options for line colors and cloud colors.
Time window for backtesting (daily, weekly, monthly, or custom date range).
Usage:
Ideal for identifying trend direction and potential entry points.
Can be used for manual trading or as part of an automated strategy with alerts.
Provides a visual and statistical overview of trading performance via the backtest panel.

Combo ProCombo Pro – Regression Channel & Long-Term Flows
This script is a visual study tool, not a trading strategy. It does not place trades or guarantee results. It simply helps to analyze price context, volatility and “flow” on the chart.
The indicator is built in three blocks:
Module A – Swing regression channel + emotional cycle
• Draws a regression channel (±σ) around price to highlight extended moves up/down.
• Adds a simple trend filter MA and basic volatility filters (ATR%).
• Includes an emotional cycle (Fear/Greed style) that tries to smooth price swings and mark potential “over-fear” / “over-greed” zones.
• “A BUY” / “A SELL” markers only show where channel + cycle conditions align; they are not automatic trade signals.
Module C – Previous candle below lower band + Fear
• Marks situations where the previous bar is below the lower regression band and the emotional cycle is in a “Fear” zone.
• Adds optional exit conditions (price back above the trend MA and/or above the Greed line).
• This module is meant to highlight potential exhaustion areas, not to provide standalone entries or exits.
Module B – Long-term MA, Whale Money Flow, TIF & SECRET votes
• Measures percentage distance from a long-term MA (pd) as a simple valuation context (cheap/expensive vs. average).
• Uses a custom Whale Money Flow to approximate when larger participants might be more/less active.
• Uses TIF (Trades in Favor) as a retail positioning/pressure gauge.
• “SECRET” logic combines valuation, whales and TIF into a vote system to highlight possible extreme zones.
• Long-term regression bands and their crosses are plotted as BUY/SELL zones only in a descriptive sense (price reaching extreme bands), not as guaranteed signal levels.

⭐ Silver HUD v15.1 — Full Notes Version (3-Column HUD)Silver HUD v15.1 is a comprehensive Pine Script v5 indicator designed for micro silver futures (SIL) trading on TradingView. It overlays a 3-column HUD table displaying real-time analysis across multiple engines including trend, flow, momentum, pullback, turbo (breakout), divergence, volume, and 2H structure. The system generates weighted BUY/SELL scores and final signals with risk warnings, optimized for 5m charts with 30m support/resistance levels.
Core Components
Support/Resistance & Trade Levels
Pulls 30m lowest low (support) and highest high (resistance) for entry/stop/TP calculation. Entry defaults to support, stop loss at support - 0.10, with ATR-based TPs (1x/2x/3x). Risk per lot factors SIL contract specs (1000oz, $5/tick). Alerts when price nears support within 0.05.
Multi-Engine Analysis
TREND: EMA20/50 + VWAP direction (UP/DOWN/MIXED).
FLOW: CCIOBV (CCI+OBV) + QQE momentum sync.
MOMENTUM: RSI/MFI >55 (UP) or <45 (DOWN).
PB (Pullback): EMA20 deviation (-0.4% to +1.2% = OK; flags CHASE/DEEP).
TURBO: ATR percentile + BB width squeeze for BREAKOUT/EXHAUST.
Scores weight flow (30%), momentum (25%), PB (25%), trend/turbo (10-20%). BUY ≥75, SELL ≥72 triggers raw signals.
Advanced Features
2H Structure: Detects HH/HL/LL/LH swings for macro bias (UP/DOWN/MIXED).
SELL System: Distinguishes SELL-ALERT (exhaustion) vs full SELL-REVERSAL (multi-condition bear flip).
Divergence & Volume: RSI-based bear/bull div on swing highs/lows; surge detection (>2x vol MA or 80th percentile).
Final Signal: Combines raw scores with filters (no DEEP PB for BUY, 2H tiebreaker); RISK flags conflicts like div or trend mismatches.
HUD Display & Usage
Renders a bottom-right table with metric, status (color-coded), and Chinese explanations. Stars rate scores (★★★★★=90+). Ideal for high-frequency SIL traders monitoring multi-timeframe confluence on 5m charts.

SYLVEREDGEPROTRENDThis indicator is the full Sylver Edge Pro™ execution engine for trading MES/MNQ on the 1-minute chart.
It combines a 20 SMA High/Low breakout system with Smoothed Heikin-Ashi (SHA) trend coloring, automatic R-multiple mapping (1R/2R/3R), structural signal-candle stops, and ONH/ONL reference levels. Entries only trigger when a confirmation candle closes beyond the signal candle high/low, so every trade is based on a clean, confirmed break.
On top of that, it adds multi-timeframe trend filters (optional 5-minute and 3-minute 20 SMA H/L trend) plus a Supertrend filter, blocking all counter-trend signals. A bottom-right Trend Panel shows “Trend: UP / DOWN / CHOP” with customizable colors, a filters status line (5m / 3m / ST ON–OFF), and sound-capable alerts that only fire when the market shifts from CHOP → UP or CHOP → DOWN, telling you when it’s safe to look for long or short setups again. The top-right R Panel tracks current R, max R reached, and drawdown from peak R, turning each trade into a controlled risk unit instead of random P&L.

TMT 1M HA Scalping INDICATOR - Hitesh Nimje📊 TMT 1 Minute HA Scalping Strategy - Hitesh Nimje
🎯 Strategy Overview
A 1-minute scalping strategy designed for high-frequency trading using Heikin Ashi-inspired crossover logic with multiple filters for precision entries.
🔧 Key Components
1. Moving Averages (Trend Detection)
LineTypePeriodColorPurposeFast SMASimple MA9🔵 BluePrimary signal lineSlow SMASimple MA21🔴 RedSecondary confirmationTrend SMASMA (1H)50⚫ BlackOverall market trend bias
2. Entry Signals (Crossover Logic)
🔥 BUY Signal: Fast SMA (9) crosses ABOVE Slow SMA (21)
🔥 SELL Signal: Fast SMA (9) crosses BELOW Slow SMA (21)
3. Entry Filters (4-Layer Confirmation)
✅ LONG Entry = Crossover + Trend Up + RSI Overbought + Bar Confirmed
✅ SHORT Entry = Crossunder + Trend Down + RSI Oversold + Bar Confirmed
longCond = sma_slope > 0 AND rsi >= 70 AND buySignal
shortCond = sma_slope < 0 AND rsi <= 30 AND sellSignal
FilterLongShortPurposeTrend Slopesma_slope > 0sma_slope < 0Market directionRSI FilterRSI >= 70RSI <= 30Momentum extremeCrossoverFast > SlowFast < SlowEntry triggerBar Statebarstate.isconfirmedbarstate.isconfirmedNo repaint
⚡ Risk Management
Stop Loss (Dynamic ATR-based)
Long SL = Lowest Low (7) - 1×ATR(14)
Short SL = Highest High (7) + 1×ATR(14)
Take Profit (1:1 Risk-Reward)
Long TP = Entry + (Entry - SL distance)
Short TP = Entry - (SL distance - Entry)
⏰ Trading Hours
📅 Active: 00:00 - 14:59 (3:00 PM cutoff)
🛑 Auto-close: All positions closed at 15:00
🎨 Visual Elements
📍 BUY Labels: 🟢 Green (below bar)
📍 SELL Labels: 🔴 Red (above bar)
📈 Fast SMA: 🔵 Blue line (9-period)
📉 Slow SMA: 🔴 Red line (21-period)
📊 Trend SMA: ⚫ Black line (50-period, 1H)
⚙️ Input Parameters
ParameterDefaultPurposeEnd of Day1500 (3 PM)Auto-close timeLot Size1Position size
🚀 How It Works (Step-by-Step)
1. Monitor Fast(9) vs Slow(21) SMA crossover
2. Check 1H Trend SMA slope (up/down bias)
3. Validate RSI extreme (70+/30-)
4. Wait for bar confirmation
5. Enter with ATR-based SL & 1:1 TP
6. Auto-exit at 3 PM or SL/TP hit
💡 Strategy Strengths
* ✅ Multi-timeframe trend filter
* ✅ RSI momentum confirmation
* ✅ Dynamic ATR stop losses
* ✅ No repaint signals
* ✅ End-of-day risk control
* ✅ 1:1 Risk-Reward consistency
Perfect for 1-minute scalping on volatile instruments! 🔥
© Hitesh Nimje | Thought Magic Trading
Contact: 8087192915
TRADING DISCLAIMER
RISK WARNING
Trading involves substantial risk of loss and is not suitable for all investors. Past performance is not indicative of future results. You should carefully consider whether trading is suitable for you in light of your circumstances, knowledge, and financial resources.
NO FINANCIAL ADVICE
This indicator is provided for educational and informational purposes only. It does not constitute:
* Financial advice or investment recommendations
* Buy/sell signals or trading signals
* Professional investment advice
* Legal, tax, or accounting guidance
LIMITATIONS AND DISCLAIMERS
Technical Analysis Limitations
* Pivot points are mathematical calculations based on historical price data
* No guarantee of accuracy of price levels or calculations
* Markets can and do behave irrationally for extended periods
* Past performance does not guarantee future results
* Technical analysis should be used in conjunction with fundamental analysis
Data and Calculation Disclaimers
* Calculations are based on available price data at the time of calculation
* Data quality and availability may affect accuracy
* Pivot levels may differ when calculated on different timeframes
* Gaps and irregular market conditions may cause level failures
* Extended hours trading may affect intraday pivot calculations
Market Risks
* Extreme market volatility can invalidate all technical levels
* News events, economic announcements, and market manipulation can cause gaps
* Liquidity issues may prevent execution at calculated levels
* Currency fluctuations, inflation, and interest rate changes affect all levels
* Black swan events and market crashes cannot be predicted by technical analysis
USER RESPONSIBILITIES
Due Diligence
* You are solely responsible for your trading decisions
* Conduct your own research before using this indicator
* Verify calculations with multiple sources before trading
* Consider multiple timeframes and confirm levels with other technical tools
* Never rely solely on one indicator for trading decisions
Risk Management
* Always use proper risk management and position sizing
* Set appropriate stop-losses for all positions
* Never risk more than you can afford to lose
* Consider the inherent risks of leverage and margin trading
* Diversify your portfolio and trading strategies
Professional Consultation
* Consult with qualified financial advisors before trading
* Consider your tax obligations and legal requirements
* Understand the regulations in your jurisdiction
* Seek professional advice for complex trading strategies
LIMITATION OF LIABILITY
Indemnification
The creator and distributor of this indicator shall not be liable for:
* Any trading losses, whether direct or indirect
* Inaccurate or delayed price data
* System failures or technical malfunctions
* Loss of data or profits
* Interruption of service or connectivity issues
No Warranty
This indicator is provided "as is" without warranties of any kind:
* No guarantee of accuracy or completeness
* No warranty of uninterrupted or error-free operation
* No warranty of merchantability or fitness for a particular purpose
* The software may contain bugs or errors
Maximum Liability
In no event shall the liability exceed the purchase price (if any) paid for this indicator. This limitation applies regardless of the theory of liability, whether contract, tort, negligence, or otherwise.
REGULATORY COMPLIANCE
Jurisdiction-Specific Risks
* Regulations vary by country and region
* Some jurisdictions prohibit or restrict certain trading strategies
* Tax implications differ based on your location and trading frequency
* Commodity futures and options trading may have additional requirements
* Currency trading may be regulated differently than stock trading
Professional Trading
* If you are a professional trader, ensure compliance with all applicable regulations
* Adhere to fiduciary duties and best execution requirements
* Maintain required records and reporting
* Follow market abuse regulations and insider trading laws
TECHNICAL SPECIFICATIONS
Data Sources
* Calculations based on TradingView data feeds
* Data accuracy depends on broker and exchange reporting
* Historical data may be subject to adjustments and corrections
* Real-time data may have delays depending on data providers
Software Limitations
* Internet connectivity required for proper operation
* Software updates may change calculations or functionality
* TradingView platform dependencies may affect performance
* Third-party integrations may introduce additional risks
MONEY MANAGEMENT RECOMMENDATIONS
Conservative Approach
* Risk only 1-2% of capital per trade
* Use position sizing based on volatility
* Maintain adequate cash reserves
* Avoid over-leveraging accounts
Portfolio Management
* Diversify across multiple strategies
* Don't put all capital into one approach
* Regularly review and adjust trading strategies
* Maintain detailed trading records
FINAL LEGAL NOTICES
Acceptance of Terms
* By using this indicator, you acknowledge that you have read and understood this disclaimer
* You agree to assume all risks associated with trading
* You confirm that you are legally permitted to trade in your jurisdiction
Updates and Changes
* This disclaimer may be updated without notice
* Continued use constitutes acceptance of any changes
* It is your responsibility to stay informed of updates
Governing Law
* This disclaimer shall be governed by the laws of the jurisdiction where the indicator was created
* Any disputes shall be resolved in the appropriate courts
* Severability clause: If any part of this disclaimer is invalid, the remainder remains enforceable
REMEMBER: THERE ARE NO GUARANTEES IN TRADING. THE MAJORITY OF RETAIL TRADERS LOSE MONEY. TRADE AT YOUR OWN RISK.
Contact Information:
* Creator: Hitesh_Nimje
* Phone: Contact@8087192915
* Source: Thought Magic Trading
© HiteshNimje - All Rights Reserved
This disclaimer should be prominently displayed whenever the indicator is shared, sold, or distributed to ensure users are fully aware of the risks and limitations involved in trading.

FCPO MASTER v6 – Sideway + Breakout + OB + FVG (TUPLE SAFE)TL;DR cepat
1. Gunakan M5 untuk entry & OB/FVG confirmation.
2. Gunakan M15 untuk confirm trend/false breakout.
3. Gunakan H1 untuk bias arah (overall market).
4. Entry hanya bila signal + OB/FVG/candle rejection (script buatkan).
5. SL 5–8 tick, TP 10–25 tick ikut setup (sideway vs breakout).
6. Follow checklist setiap trade — jangan lompat.
________________________________________
Setup awal (1–2 min)
1. Pasang script FCPO Sideway MASTER – OB + Imbalance + Confirmation di TradingView.
2. Timeframes: buka M5, M15, H1 (susun 3 chart atau 1 chart multi-timeframe).
3. Input default: ATR14, Breakout Buffer 5 tick, RangeLen 20, ADX14, TP12, SL8. (Kau boleh tweak nanti).
4. Aktifkan alerts pada BUY Confirm / SELL Confirm / Sideway Buy / Sideway Sell.
________________________________________
Step-by-step trading process
1) Mulakan dengan H1 — tentukan bias HTF
• Lihat H1 untuk jawapan: Trend Up / Down / Sideway.
• Rule ringkas:
o ADX H1 > 20 + price above H1 EMA → bias Bull
o ADX H1 > 20 + price below H1 EMA → bias Bear
o ADX H1 < 20 → market HTF sideway (no strong bias)
Kenapa: H1 bagi kau idea “kalau breakout pada M5, patut follow atau tolak”.
________________________________________
2) Pergi ke M15 — confirm trend & valid breakout
• M15 kena setuju dengan idea breakout.
o Untuk strong breakout: M15 kena tunjuk candle close di atas/bawah range + volume naik.
o Kalau M5 breakout tapi M15 tak setuju (M15 masih sideway) → treat as fakeout. Jangan masuk.
________________________________________
3) M5 — cari entry & confirmation (OB/FVG + candle)
• M5 adalah tempat kau buat keputusan masuk.
• Tunggu script keluarkan Sideway Buy/Sell atau Breakout Buy/Sell.
• CONFIRM entry mesti ada sekurang-kurangnya 1 dari:
o Bull/Bear Order Block searah signal (script detect).
o FVG / Imbalance zone dipenuhi & price retest.
o Candle rejection (pinbar / bearish/bullish engulfing) pada zone.
Jika tiada confirmation → no trade.
________________________________________
4) Checklist sebelum tekan Buy/Sell (MUST)
• H1 bias tidak melawan trade (prefer sama arah).
• M15 confirm breakout / trend or neutral.
• Script keluarkan signal (sideway or breakout).
• OB or FVG atau candle rejection ada.
• ATR kenaikan jika breakout (untuk breakout trade).
• Volume spike jika breakout.
• Risk:SL <= 2% akaun (position sizing).
Kalau semua ticked → boleh entry.
________________________________________
5) Setting SL / TP & position sizing
• Sideway (scalp): SL = 5–8 tick, TP = 8–12 tick.
• Breakout (trend): SL = 8–12 tick, TP = 15–25+ tick (trail later).
• Position sizing: Risk per trade 1–2%.
o Lot size = (Account Risk RM × 1 tick value) / (SL ticks × tickValue) — (kalau kau gunakan fixed tick value, adjust ikut lot).
(Script tunjuk SL & TP label — follow itu.)
________________________________________
6) Entry types
• A. Sideway Reversal (M5)
o Signal: Sideway Buy / Sideway Sell
o Confirm: OB/FVG or rejection candle at range bottom/top
o Trade: scalp target 8–12 tick, tight SL 5–8 tick
• B. Breakout (M5 entry, M15 confirm)
o Signal: Breakout Buy/Sell (Strong)
o Confirm: ATR expanding + volume spike + M15 alignment
o Trade: trend follow, TP 15–25 tick, trailing stop active
• C. Retest Entry
o Breakout happens, price returns to retest range / OB / FVG → wait for rejection candle then enter. Safer.
________________________________________
7) Trailing & exit rules
• Jika useTrail = true script plots trailing stop (ATR × multiplier).
• Exit rules:
1. Hit TP → close.
2. Hit SL → close.
3. If trailing stop hit → close.
4. If opposing confirmed signal muncul (e.g., SELL confirm while long) → consider close early.
5. If H1 bias flips strongly vs trade → tighten stop or close.
________________________________________
8) Multiple signals & scaling
• Never add to losing position (no averaging down).
• If want scale-in on confirmed trend: add 1 partial size after price moves +10–12 tick in favor and shows continuation candle + no bearish OB/FVG.
• Keep aggregated risk within your max (2–3%).
________________________________________
9) Example trade walkthrough (concrete)
• RangeHigh = 4065, RangeLow = 4035 (contoh).
• Market sideway M5.
Case A — Sideway Sell:
1. Price touches 4064–4065, script shows sidewaySell.
2. Lihat OB: ada bear OB zone di 4062–4066 → confirm.
3. Candle rejection (bearish pinbar) muncul → enter SELL M5.
4. Set SL = 5 tick above rangeHigh = 4070, TP = 10 tick → 4055.
5. Trail jika price turun > 8 tick: aktifkan trailing.
6. Close at TP or trail/SL.
Case B — Breakout Buy:
1. Price closes above 4065 + 5 tick buffer = 4070 on M5. Script shows trueBreakUp.
2. M15 shows candle close above M15 resistance + volume spike → confirm.
3. Enter BUY, SL = 8 tick below entry, TP initial 20 tick, trail with ATR×1.5.
4. Move stop to breakeven after +10 tick, scale out half at +12 tick, leave rest to trail.
________________________________________
10) Journal & review
• Semua trade: record entry time, TF, reason (which confirmations), SL/TP, result, lesson.
• Weekly review: check which confirmation worked best (OB vs FVG vs candle) and tweak settings.
________________________________________
11) Tweaks / optimisations cepat
• Jika terlalu banyak false sideway signals → kurangkan touchDist ke 2 tick.
• Kalau fakeout breakout banyak → tambah tickBuf ke 6–8.
• Nak lebih konservatif → cuma trade breakout yang juga setuju M15.
________________________________________
12) Alerts & execution (practical)
• Pasang alert pada BUY Confirm / SELL Confirm (script).
• Kalau kau guna broker yang support one-click order, siap sediakan template order (SL/TP default).
• Kalau manual, bila alert masuk: buka M5, cepat confirm OB/FVG & candle rejection → entry.
________________________________________
Quick reference table (handy)
• TF utama entry: M5
• Confirm mid-TF: M15
• Bias HTF: H1
• Sideway SL/TP: SL 5–8, TP 8–12
• Breakout SL/TP: SL 8–12, TP 15–25+
• Mandatory confirmation: (Script signal) + (OB or FVG or candle)

Trade Pivot ProEnglish (required first):
Trade Pivot Pro is a comprehensive indicator that combines advanced Pivot Point calculations, Moving Averages (SMA & EMA), ATR-based volatility bands, time cycle logic, and customizable alerts.
Key Features
Pivot Points: Multiple calculation methods (Traditional, Fibonacci, Woodie, Classic, DM, Camarilla).
Flexible Time Cycles: Automatic pivot anchoring based on chart timeframe, plus manual options (Daily, Weekly, Monthly, Quarterly, Yearly, Bi-yearly, Tri-yearly, Quinquennial, Decennial).
Moving Averages: Four configurable SMA/EMA lines (21, 50, 100, 200 periods) with slope detection.
ATR Bands: Dynamic upper and lower bands plotted around price to visualize volatility.
Alerts:
MA slope changes (Up/Down).
Pivot + 200 SMA trend confirmation.
ATR volatility threshold (High/Low).
Combined Pivot + SMA + ATR strong trend alerts.
Time Cycles
Chart Timeframe Pivot Timeframe
10s 15 minutes
1m 1 hour
5m 4 hours
15m 1 day
1h 1 week
4h 1 week
1D 1 month
1W 3 months
1M 1 year
This indicator helps traders identify trend direction, volatility conditions, time cycles, and key support/resistance levels in one unified tool. It is suitable for intraday and higher timeframes, with options to use daily-based or intraday pivot values.
Note: This script is free of advertisements and intended purely for educational and trading analysis purposes.

Мой скриптinputs:
window(1),
type(0), // 0: close, 1: high low, 2: fractals up down, 3: new fractals
persistent(False),
exittype(1),
nbars(160),
adxthres(40),
nstop(3000);
vars:
currentSwingLow(0),
currentSwingHigh(0),
trailStructureValid(false),
downFractal(0),
upFractal(0),
breakStructureHigh(0),
breakStructureLow(0),
BoS_H(0),
BoS_L(0),
Regime(0),
Last_BoS_L(0),
Last_BoS_H(0),
PeakfilterX(false);
BoS(window,persistent,type,Bos_H,BoS_L,upFractal,downFractal,breakStructureHigh,breakStructureLow);
//BOS Regime
If BoS_H <> 0 then begin
Regime = 1; // Bullish
Last_BoS_H = BoS_H ;
end;
If BoS_L <> 0 Then begin
Regime = -1; // Bearish
Last_BoS_L = BoS_L ;
end;
//Entry Logic: if we are in BoS regime then wait for break swing to entry
if ADX(5) of data2 < adxthres then begin
if time>900 and Regime = 1 and EntriesToday(date)= 0 and Last_BoS_H upFractal then buy next bar at market;
end;
if time>900 and EntriesToday(date)= 0 and Regime = -1 and Last_BoS_L>downFractal then
begin
if close < downFractal then sellshort next bar at market;
end;
end;
// Exits: nbars or stoploss or at the end of the day
if marketposition <> 0 and barssinceentry >nbars then begin
sell next bar at market;
buytocover next bar at market;
end;
setstoploss(nstop);
setexitonclose;
